Flavio Espinoza
Street Fighter is a commissioned production crypto trading terminal I designed and built end-to-end for a paying client who hated TradingView — a custom D3.js charting engine, a visual order-entry layer, a Fibonacci batch-order system, a server-side auto-trade engine, and a real-time Node backend wired straight into the exchange. The whole premise came from one client sentence: "I wish it was more like a video game, like Street Fighter." He wanted to fight the market with his hands — click an order line and drag it down to catch the bottom, drag it up to chase a rally — on coins TradingView would not let him trade. There was no spec. There was a frustration and a name. I built the rest.
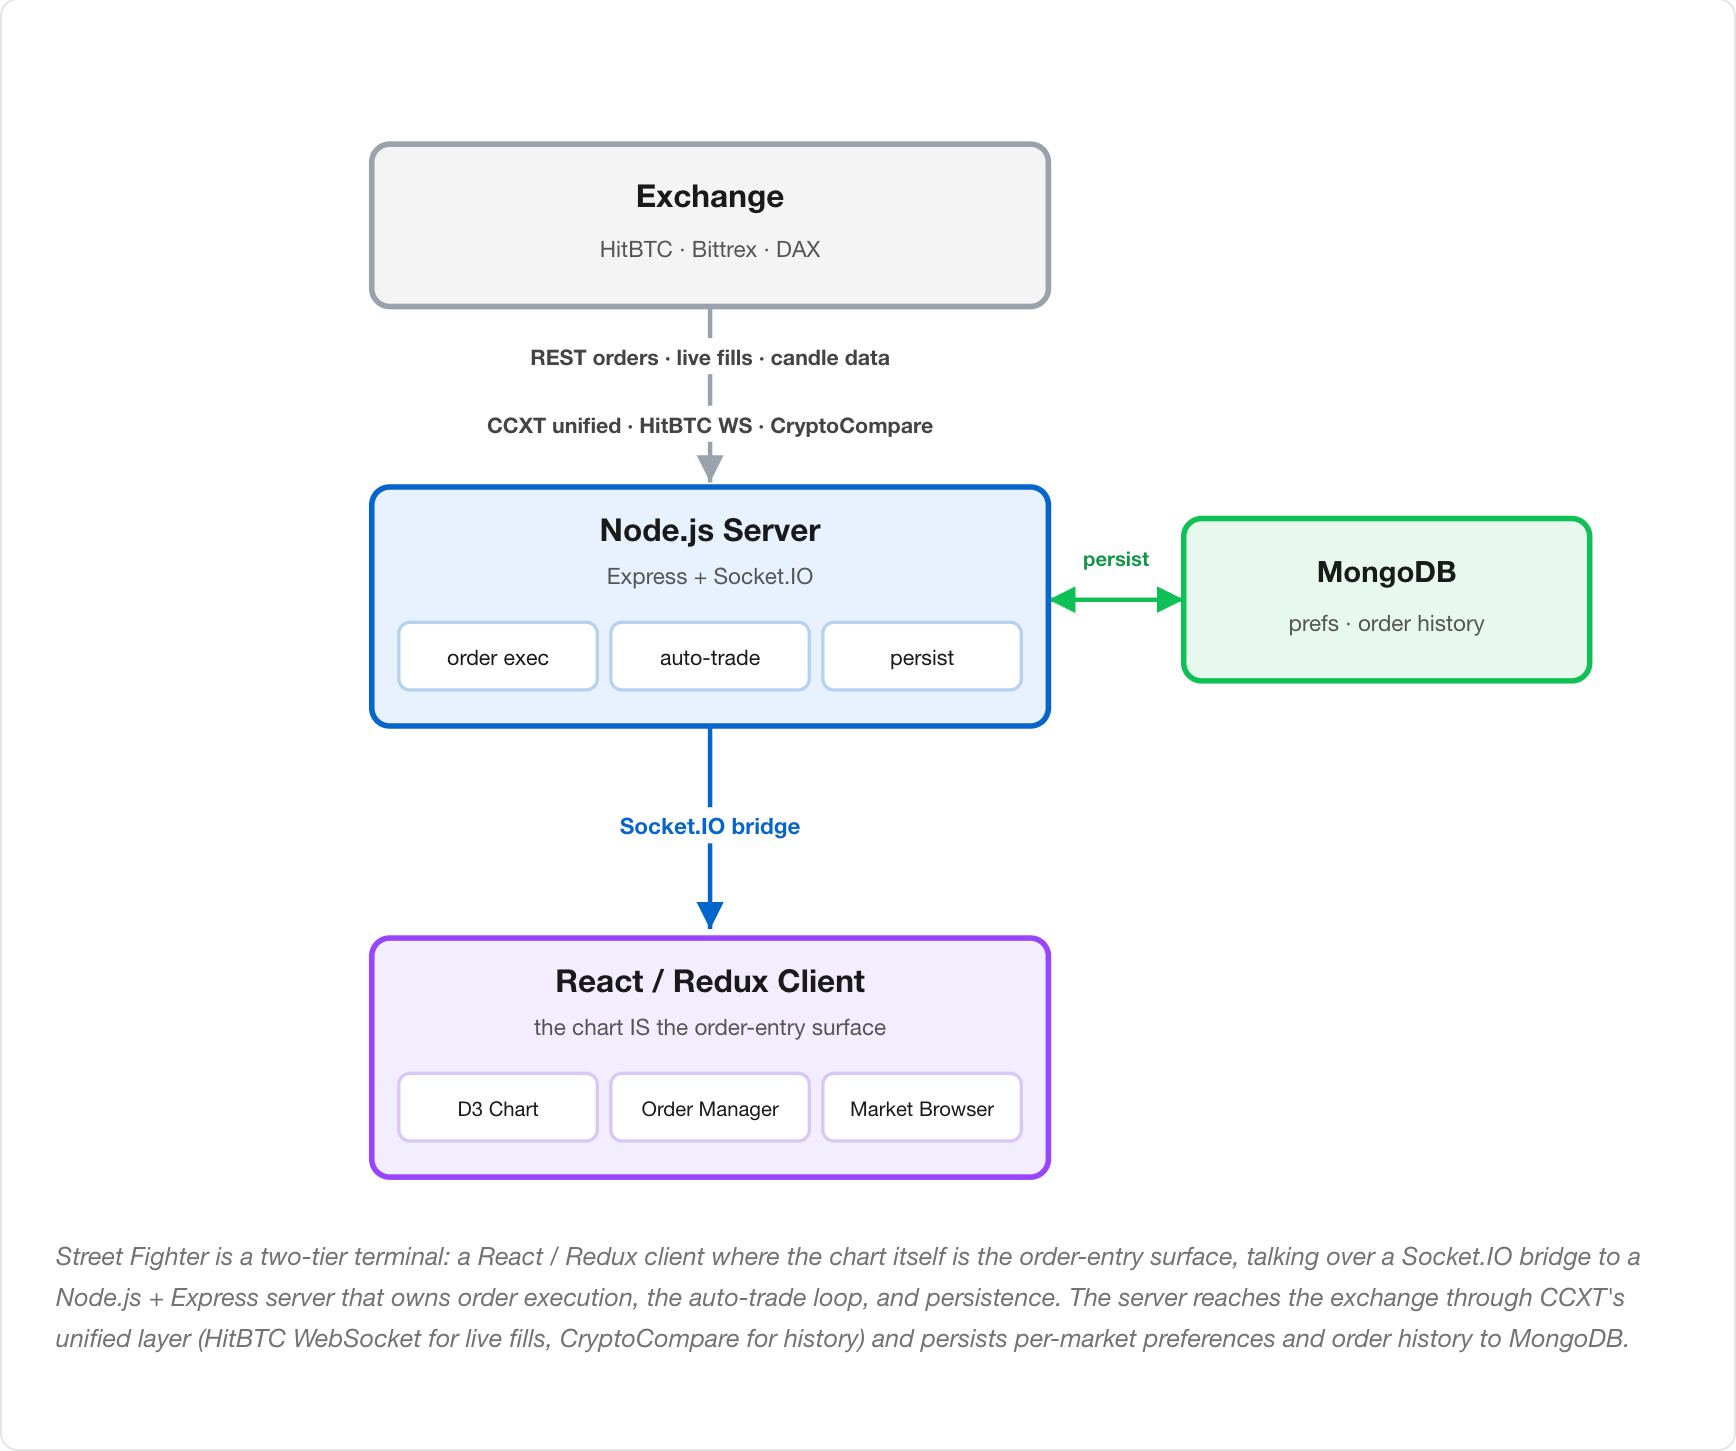
The Architecture
Street Fighter is a two-tier real-time terminal. A React / Redux client — where the chart itself is the order-entry surface — talks over a Socket.IO bridge to a Node.js + Express server that owns everything risky: order execution, the auto-trade loop, and persistence. The server reaches the exchange through CCXT's unified trading layer, taking live fills off the HitBTC WebSocket and history from CryptoCompare, and persists per-market preferences and order history to MongoDB. The diagram below traces that path — exchange in, the server in the middle holding the truth, the browser as a live window onto it — and the sections that follow open up each piece: the chart engine, chart-as-order-entry, drag-to-modify, the Fibonacci batch system, the auto-trade engine, the live state layer, and the backend.
I built it in versions — control, variant, measure, ship the winner, then start again on the next one:
- v1 — DAX: the first build, proving the chart-as-order-entry idea on one exchange.
- v2 — Bittrex + HitBTC: widened to two exchanges through a unified trading layer to find which one the client actually needed.
- v3 — HitBTC: the winner, narrowed back to the single exchange that fit the client's coins and execution, and hardened for daily live trading.
Every line of this — architecture, backend, UI/UX, the charting internals — I wrote by hand. This was 2017-2018, before AI coding tools existed: just me, Google, and Stack Overflow.
The Chart Engine
The core of the product — a full candlestick charting engine built on D3.js v4 from a heavily reworked fork of react-stockcharts, not a wrapper around a third-party widget. This is the surface the client wanted to "play like a video game," so it had to render fast and respond to direct manipulation, not just display data.
- Ground-up rendering pipeline — a Canvas/SVG hybrid (CanvasContainer + GenericChartComponent) so large candle datasets stay smooth while interactive overlays stay crisp, with zoom, pan, crosshair, edge price indicators, and an OHLC hover tooltip.
- A full technical-indicator library written from scratch as individual calculators — SMA, EMA, WMA, TMA, RSI, Stochastic, MACD, Bollinger Bands, ATR, Parabolic SAR, Elder Ray, Force Index — plus alternative chart types (Heikin-Ashi, Renko, Kagi, Point & Figure). I owned the math, not just the layout.
- Configurable intervals from 1m to 1d, with completed trades plotted directly on the candle where they filled (blue = buy/long, pink = sell/short) so past decisions have immediate visual context instead of living in a separate table.
Chart-as-Order-Entry
The defining idea: orders are not placed in a side form, they live on the price chart as draggable lines. This is what made it "Street Fighter" instead of a dashboard — the chart is the controller.
- Open orders render as horizontal lines on the chart, dashed and color-coded by side, sitting at their exact price level so the client reads his whole book at a glance against live price.
- The interactive layer is wired straight into the execution pipeline — a line is not an annotation, it is a live order; moving it moves real money on the exchange.
- The same interactive system carries a full set of analysis tools the client asked for over time — trend lines, equidistant and standard-deviation channels, a Gann fan, a ruler for measuring price/percentage/time, and click-to-place text — each shippable on its own as he found new things he wanted while trading.
Drag-to-Modify Orders
The feature the whole project was named for, and the one I am proudest of. The client wanted to grab a resting order and drag it — pull a bid down as the market dropped to catch the bottom, push it up to chase a rally — and have it just happen. What looks like one smooth drag is a strict sequence of asynchronous exchange operations that all have to land in order, or money goes missing. When you release a dragged buy line, the server runs this chain, and the order matters:
- Cancel the old order on the exchange.
- Wait — the escrowed funds have to be released back into the account first.
- Recalculate the amount from available funds, preserving total cost (
old_cost / new_price). - Place a fresh limit order at the dragged-to price.
- Atomic cancel-and-replace — the old order is cancelled, then the new one is placed, as one user gesture. The client never thinks about the two-step reality underneath.
- The escrow wait was the hard-won part. You cannot place the replacement the instant you cancel — the funds held against the old order have to settle back into the available balance first, or the exchange rejects the new order. Getting that timing right across real async exchange calls is exactly where I fell in love with async/await; the sequence is modeled as an explicit promise that waits for the release before continuing.
- Cost-preserving recalculation — on a buy, dragging to a new price means a new quantity. The server recomputes
new_amount = (old_amount * old_price) / new_priceso the dollar amount the client committed stays constant as the line moves. He drags by price; the size takes care of itself.
Fibonacci Batch Orders + Paradigm Distribution
The killer feature, and the clearest place the build became a growth-style optimization problem. Every platform has a Fibonacci indicator that just draws lines. The client and I wanted it to trade: draw the fib across a price range and drop a real limit order at every rung in one action, weighted so the deepest rung — the biggest dip — carries the most capital, because that fill makes the most money.
- Draw once, place many — the trader drags a Fibonacci retracement between two prices and the system fans 10+ limit orders across the levels in a single confirm, instead of hand-entering each one. This was built to "cover a spread and hit a lot": spread the orders so the market sweeping through fills many of them.
- The distribution is the strategy. A library of "paradigms" — single, linear, equal-weight, concave (front-loaded), convex (back-loaded), sigmoid (center-weighted) — decides how the risk capital is shaped across the rungs. The trader picks a curve and a total risk amount; the system sizes every order to match. Front-loading the deepest rungs was the control we kept coming back to because it paid the most when price dipped and recovered.
- The distribution grid is an editable react-datasheet — fib level, weight, percent of total, BTC risk, resulting amount — so the client could see the whole batch and tweak the curve before committing. Control → variant → measure which curve filled and paid → keep the winner → try the next: the loop ran inside this one feature.
- Draw is the proposal, Confirm is the commit — after you draw the fib, the whole batch stays on the chart as staged rungs you can keep adjusting; not a single order touches the exchange until you click Confirm on the buy menu. That staging gate is what made deploying 10+ orders at once safe instead of reckless: you see the entire batch, retune it, then commit it in one click.
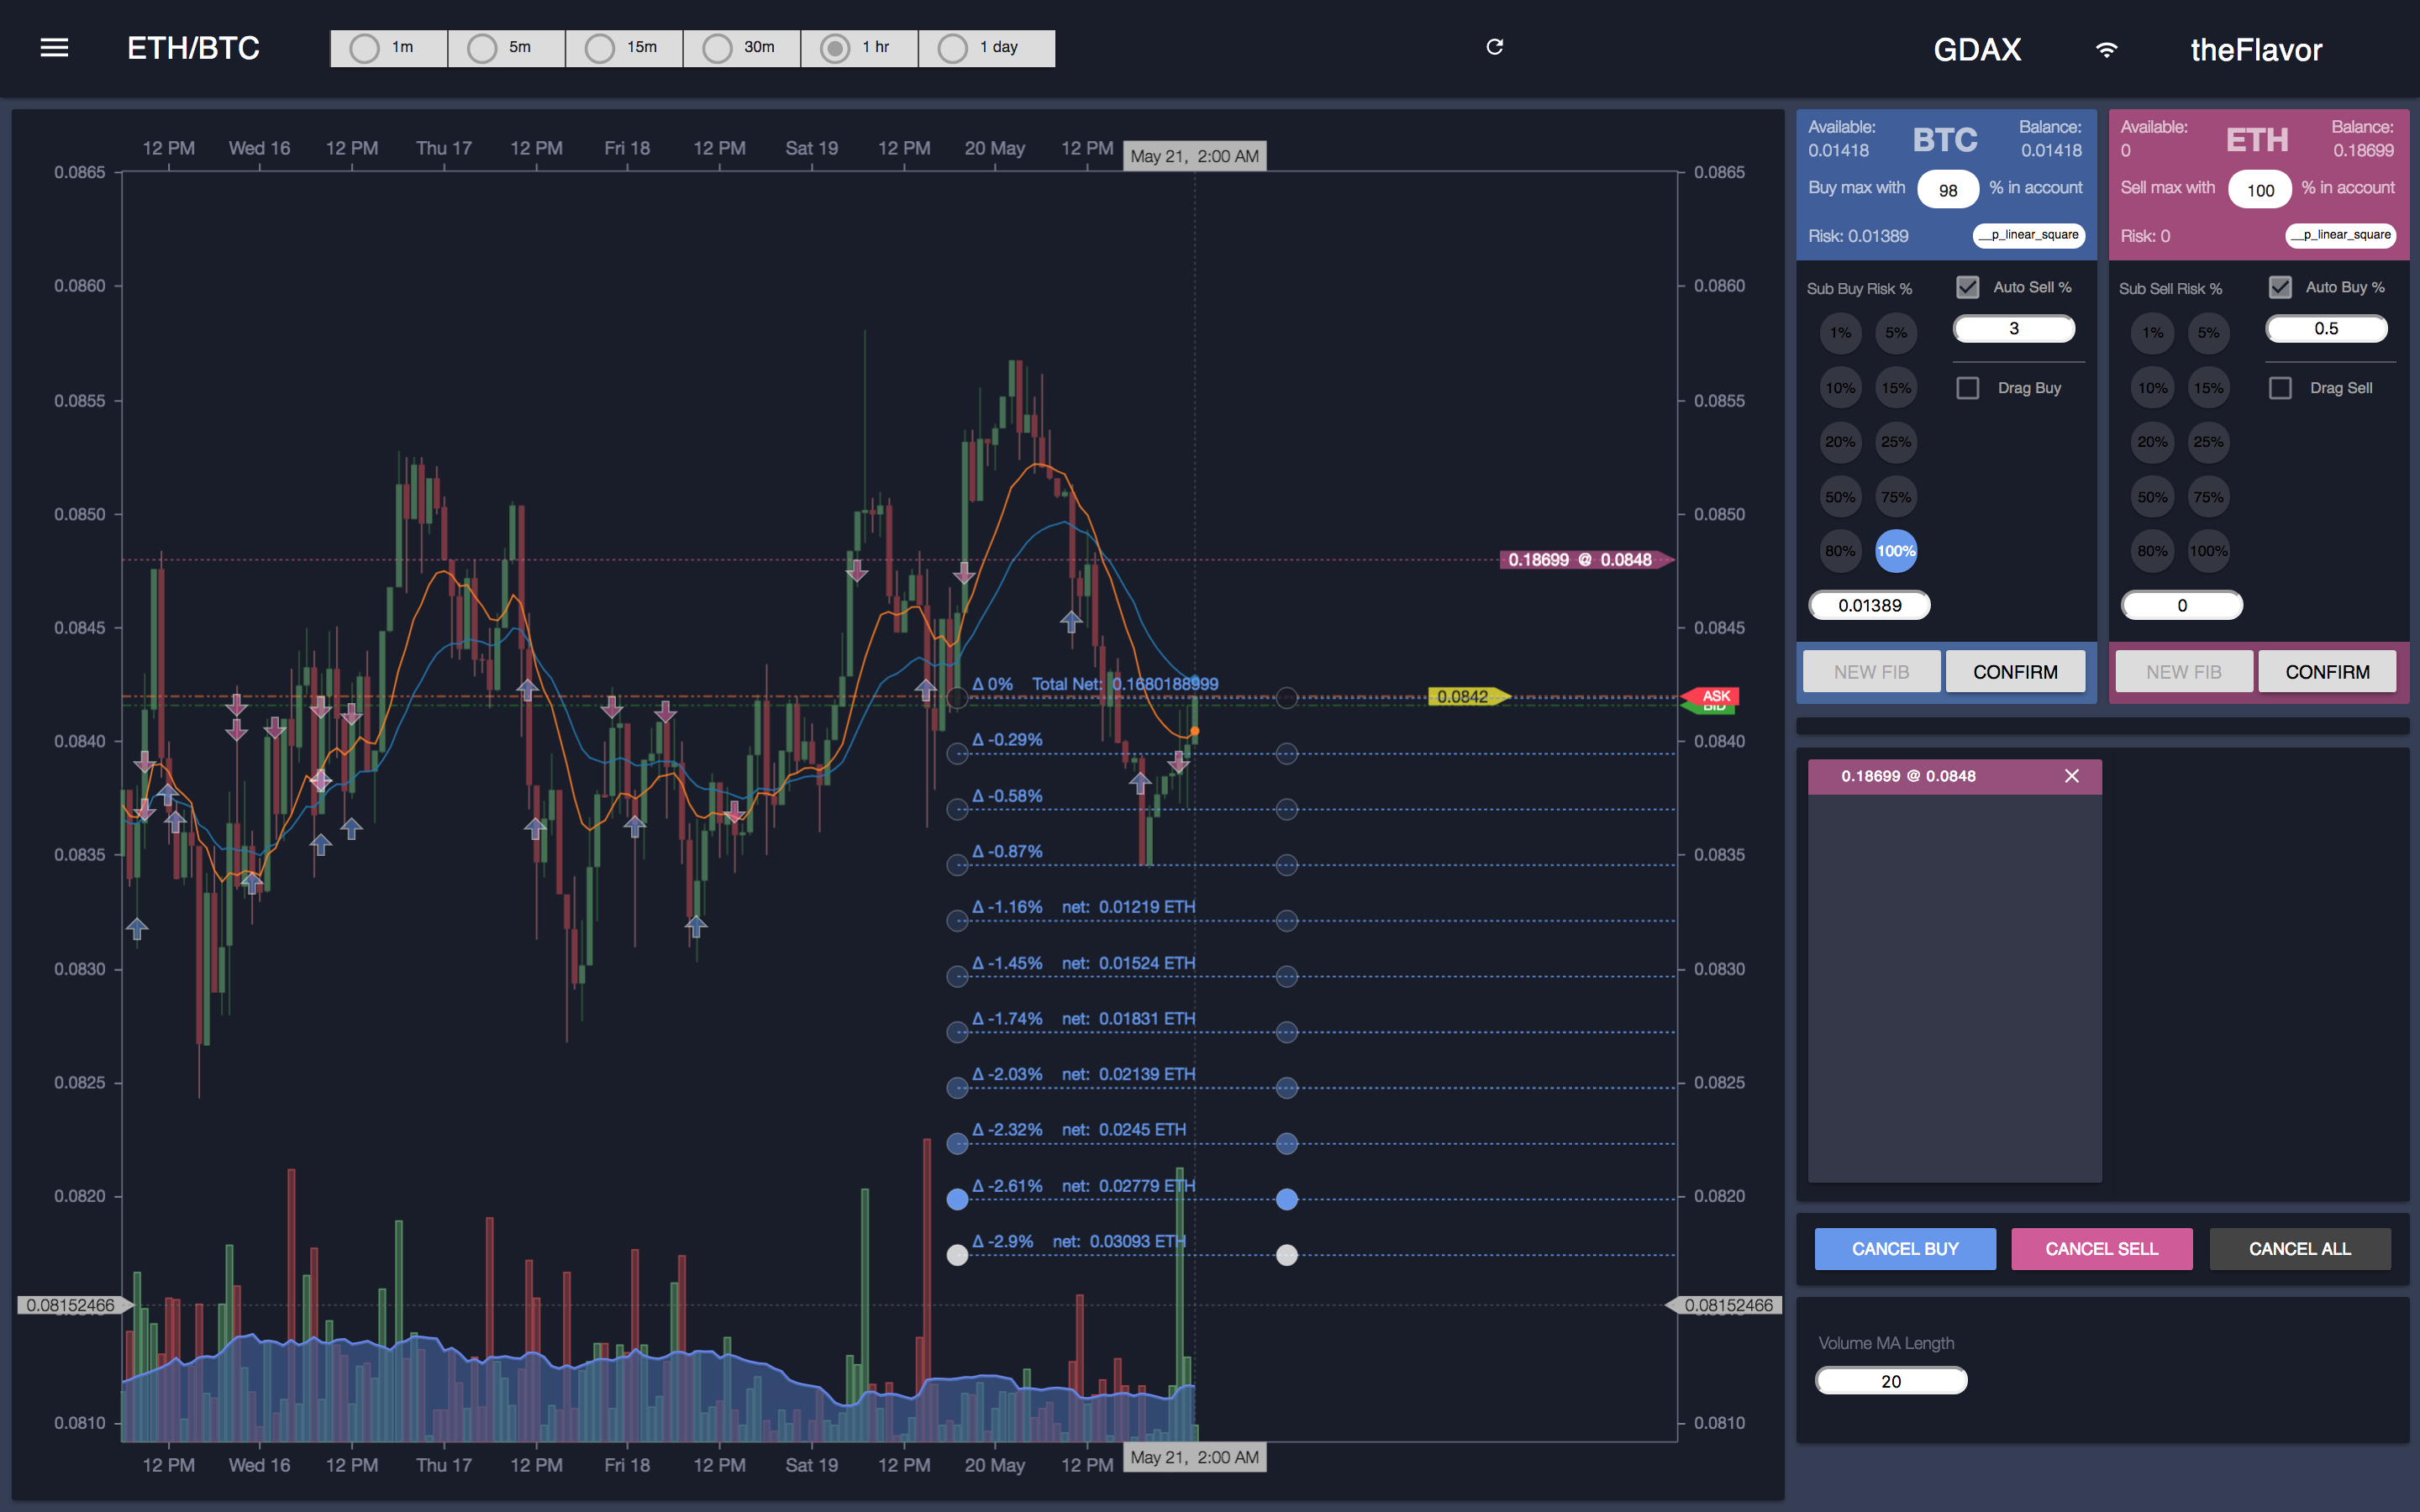
Screenshot 1 of 3 — draw and release. The fib stays on the chart as staged rungs; every rung shows its percentage delta and target price, and the deepest rungs carry the most capital. Nothing is on the exchange yet.
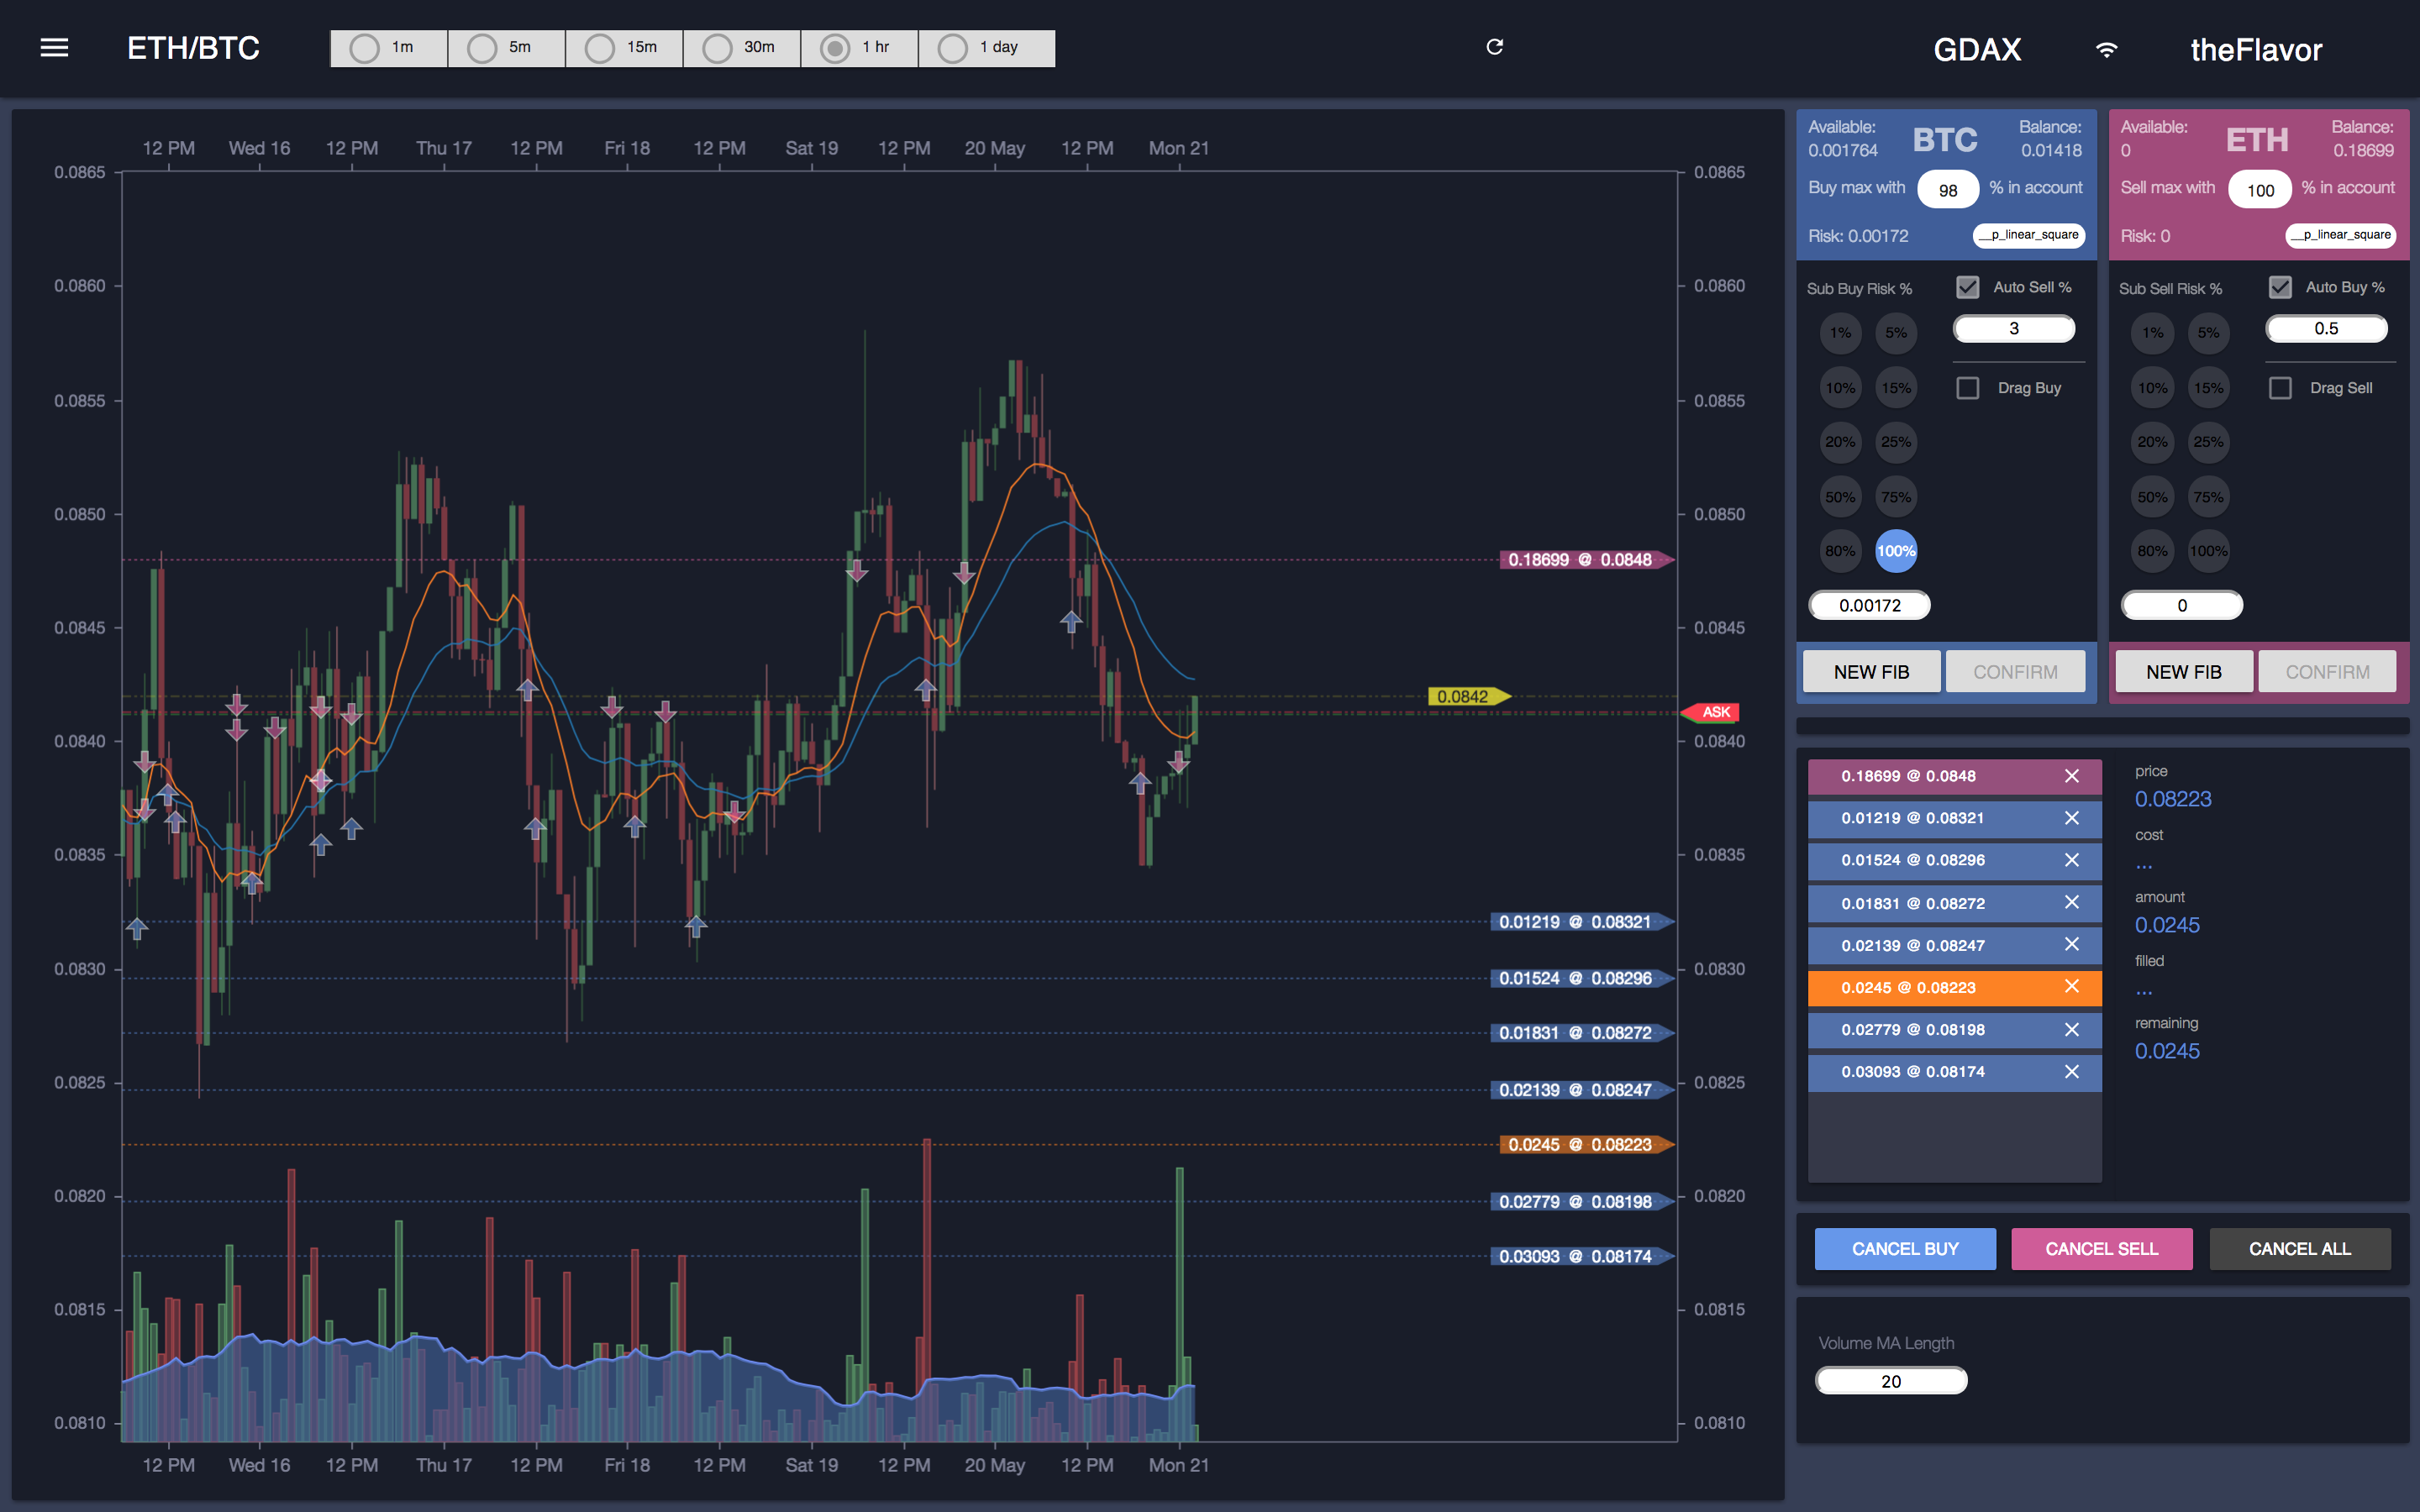
Screenshot 2 of 3 — adjust. Click any rung and it highlights orange; you can move it to retune the batch while it is still staged.
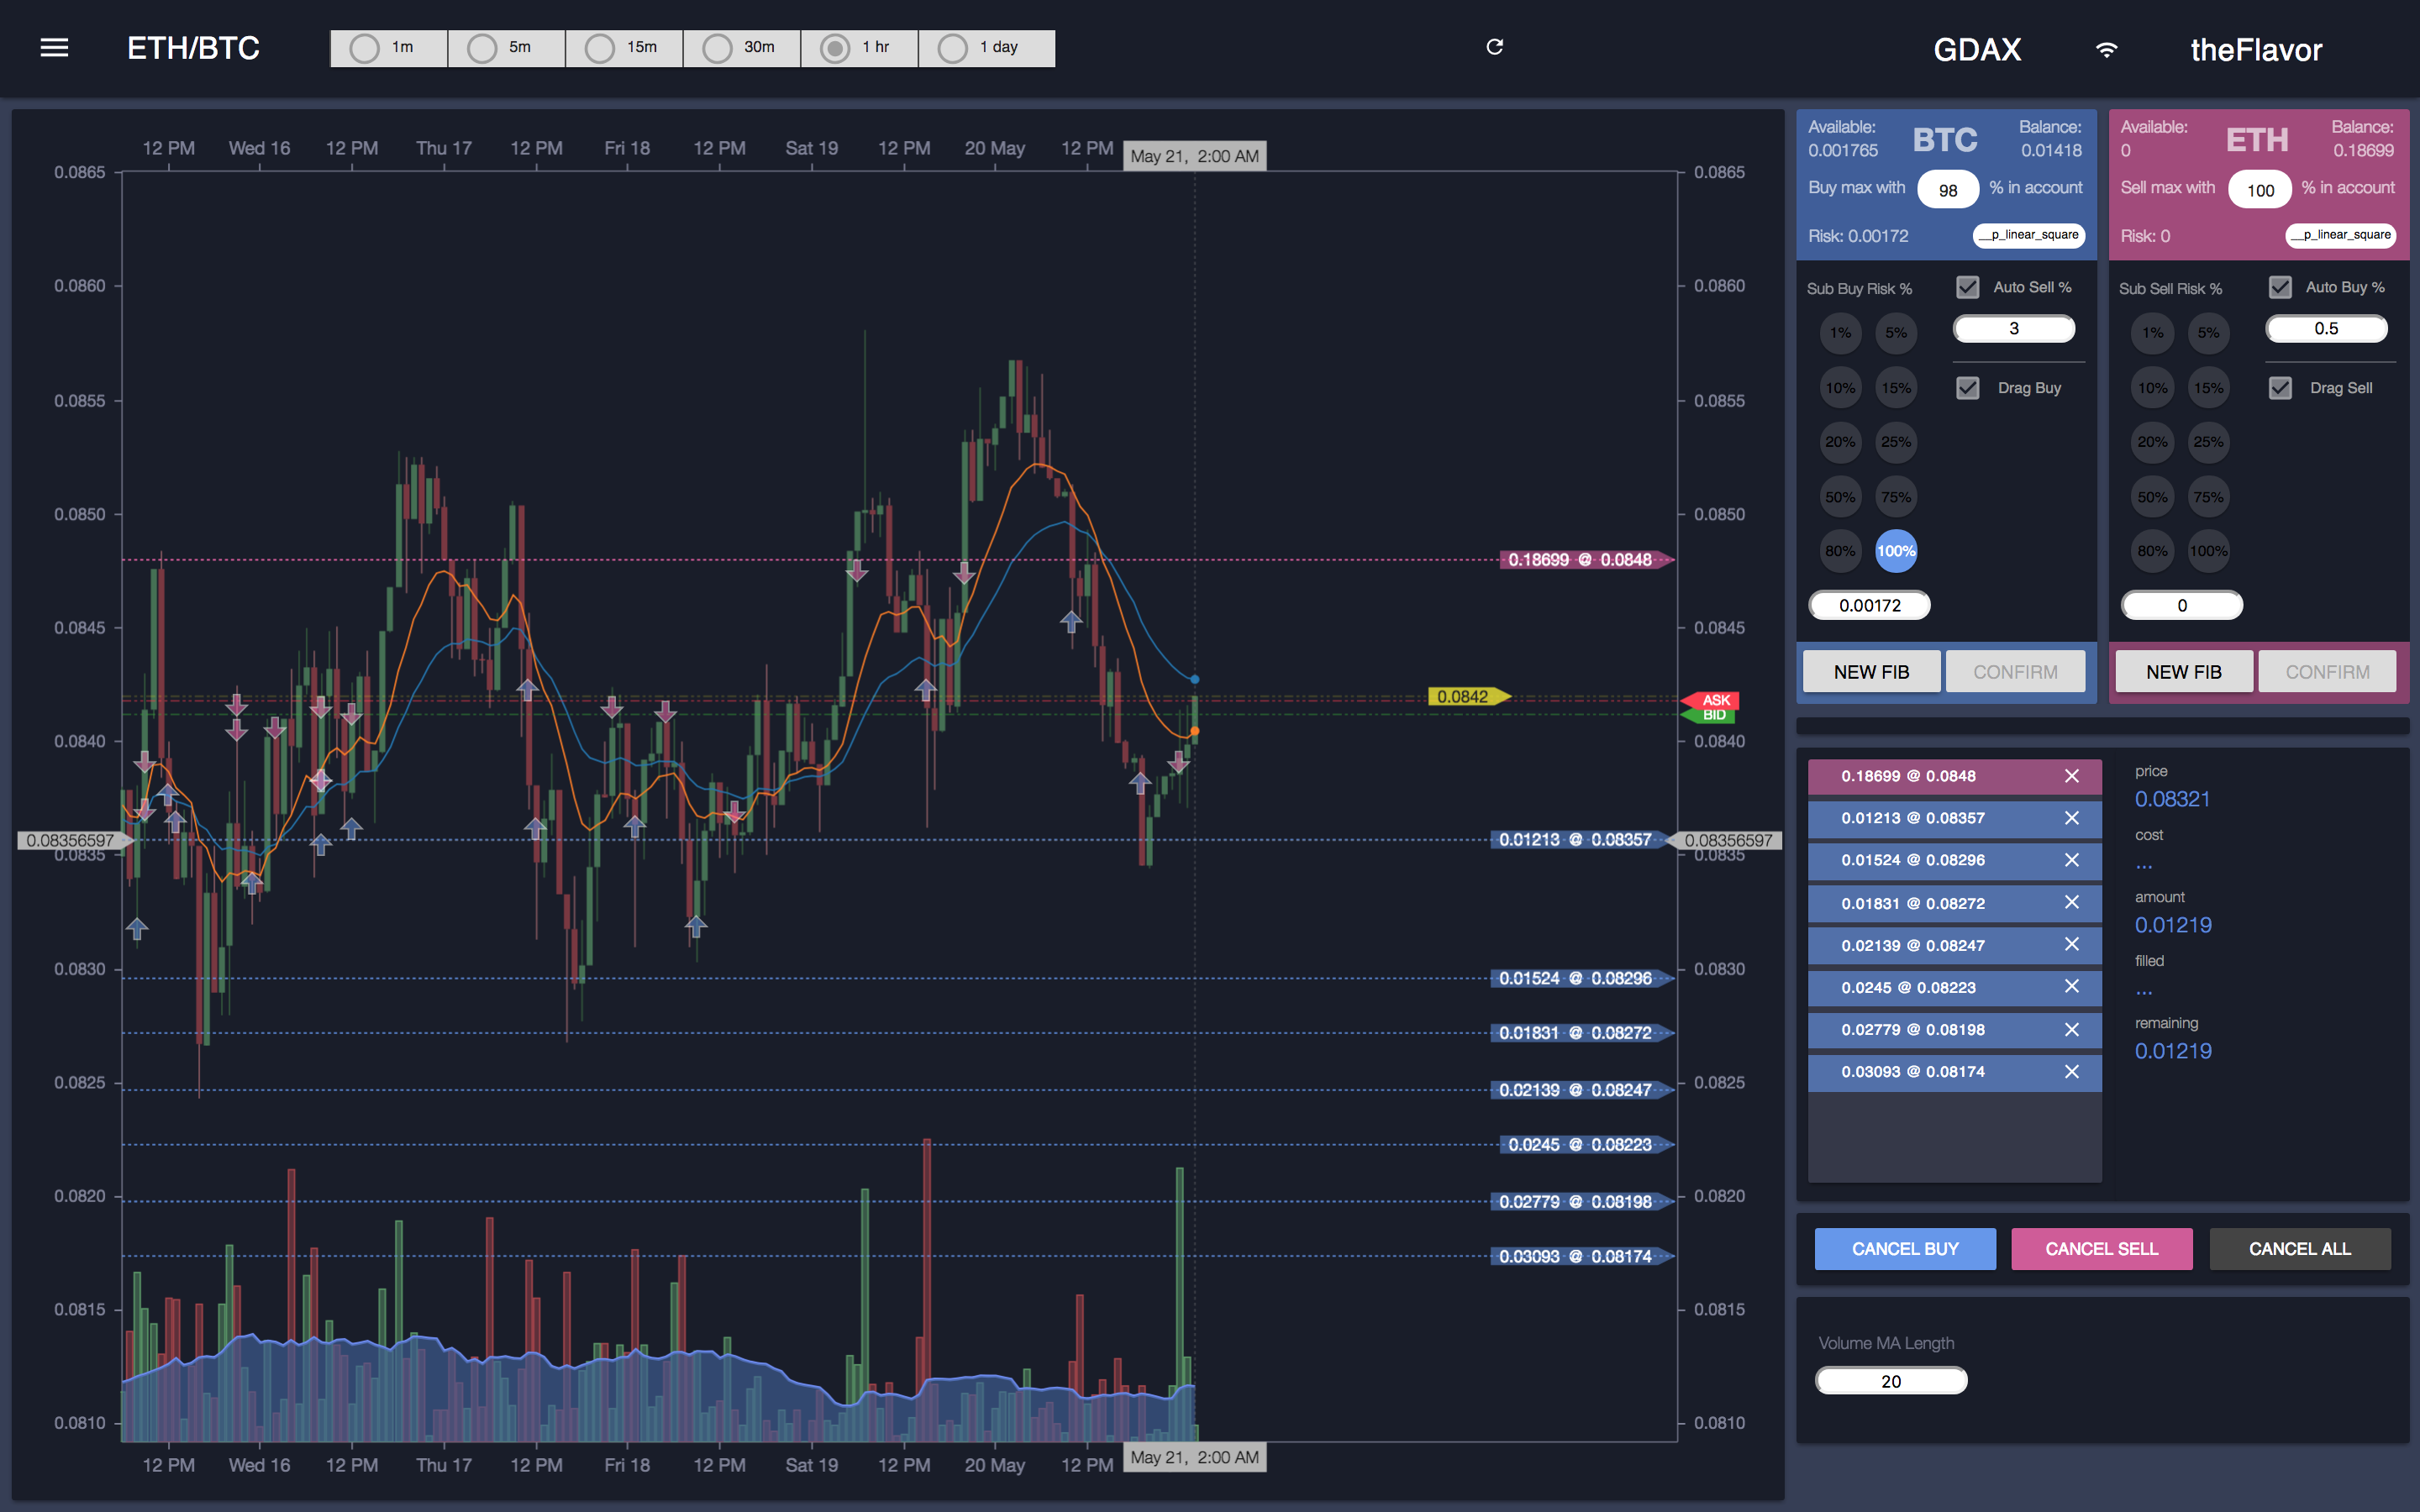
Screenshot 3 of 3 — drag to retune, then commit. The rung moves to its new level; only Confirm on the blue BTC buy menu turns the staged batch into real orders.
Auto-Trade Engine
A server-side engine that chains the opposite order automatically when a fill happens, turning a hand-placed grid into a semi-automated strategy that runs whether or not the browser is open.
- Fill-triggered chaining — when a buy fills, it auto-places a sell at
buy_price + (buy_price * sell_pct); when a sell fills, it auto-places a buy below by the same logic. Default margin 1.25%, configurable and toggleable per side. - A blacklist guards against the engine eating itself — every order the engine places is recorded so its own fill does not trigger another counter-order and cascade. This was the bug that taught me to build the guard: the loop has to know which fills are its own.
- Settings persist per market in MongoDB, so the chosen margin and toggles survive restarts and follow each trading pair. Set a fib grid, turn on auto-sell at a margin, walk away — the server keeps trading the strategy.
Real-Time Order and Depth Management
The live state layer — everything the trader sees stays in sync with the exchange the instant anything changes, because you cannot drag-trade against stale prices.
- The HitBTC WebSocket pushes fill, partial-fill, and cancel events that update the open-order lines, balances, and history overlay immediately — no polling lag between a fill and what the chart shows.
- A D3.js depth chart renders cumulative bid/ask volume as a horizontal bar chart with brush-zoom and a mini-map, so the order book is something you read visually rather than scroll through.
- Balances refresh after every order event, so the capital available for the next drag-to-modify or fib batch is always the real number.
The Backend
A Node.js + Express + Socket.IO server that sits between the exchange and the browser and owns everything risky — order execution, the auto-trade loop, and persistence. I owned this end to end alongside the frontend; it was never "just the client."
- CCXT as the unified trading layer — order placement, cancellation, balances, and market data go through exchange-agnostic methods (
create_limit_buy_order,cancelOrder,fetchOpenOrders,fetchBalance). That abstraction is what made the multi-version exchange hop (DAX → Bittrex + HitBTC → HitBTC) a change of construction, not a rewrite. - Socket.IO is the bridge — a clean event contract in both directions (
candle_data,order_update,all_balancesdown;place_fib_buy_orders,replace_order,toggle_auto_sellup) so the React client stays a thin view over a backend that holds the truth. - MongoDB persists per-market preferences and order history; CryptoCompare supplies historical OHLCV to seed the chart while the exchange WebSocket keeps it live. The server stays up and trading on its own — the browser is a window into it, not a dependency.
Built in Versions — the loop that shipped it
This is where the iterate-until-it-clicked story lives at the project level. There was no spec and no PM — a frustrated trader, a name, and a willingness to keep rebuilding until the tool did what he meant.
- v1 on DAX proved the one idea that mattered — you can trade by dragging on the chart — on a single exchange before building anything else around it.
- v2 widened to Bittrex and HitBTC through the CCXT layer, deliberately running two exchanges to learn which one actually served the client's coins and execution. That is the variant step: ship both, measure against the real use, do not guess.
- v3 narrowed back to HitBTC — the winner — and hardened it for daily live trading. Promote the proven control, drop the rest, then keep iterating features (more tools, the auto-trade guard, the fib curves) on top of the version that worked. This project later won me the Sol Engine commission: the client saw Street Fighter on my resume, I walked him through it, and that was the proof.